Android and iOS Devices Account For 96.4% of 300M+ Global Smartphone Market Shipments In Q414 – IDC
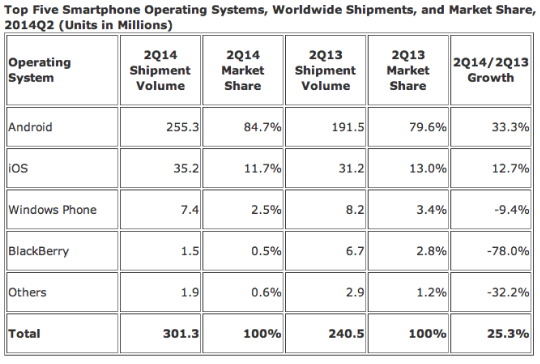
The worldwide smartphone market reached a new milestone in the second quarter of 2014 (2Q14), moving past the 300 million unit mark for the first time in its history. According to final data from the International Data Corporation (IDC) Worldwide Quarterly Mobile Phone Tracker, vendors shipped a total of 301.3 million smartphones worldwide in 2Q14 — up 25.3% from the 240.5 million units shipped in the second quarter of 2013.
The dominant smartphone operating systems (OS), Android and iOS, saw their combined market share swell to 96.4% for the quarter, leaving little space for competitors. Android was the primary driver with its vendor partners shipping a total of 255.3 million Android-based smartphones in 2Q14, up 33.3% year over year. Meanwhile, iOS saw its market share decline despite posting 12.7% year-over-year shipment growth. While Android and iOS both realized gains from a year ago, the rest of the market recorded losses.
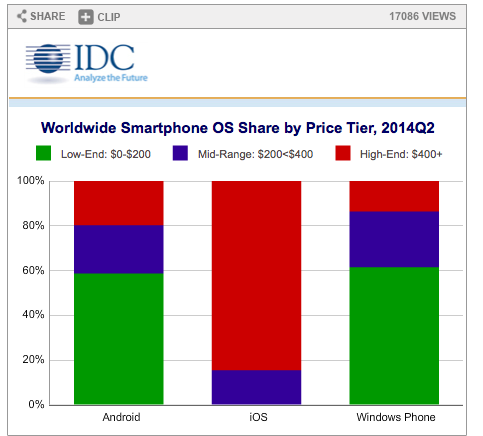
“With many of its OEM partners focusing on the sub-$200 segments, Android has been reaping huge gains within emerging markets,” says Ramon Llamas, Research Manager with IDC’s Mobile Phone team. “During the second quarter, 58.6% of all Android smartphone shipments worldwide cost less than $200 off contract, making them very attractive compared to other devices. With the recent introduction of Android One, in which Google offers reference designs below $100 to Android OEMs, the proportion of sub-$200 volumes will climb even higher.”
“It’s been an incredible upward slog for other OS players — Windows Phone has been around since 2010 but has yet to break the 5% share mark, while the backing of the world’s largest smartphone player, Samsung, has not boosted Tizen into the spotlight,” says Melissa Chau, Senior Research Manager with IDC’s Worldwide Quarterly Mobile Phone Tracker. “The biggest stumbling block is around getting enough partnerships in play — not just phone manufacturers but also developers, many of which are smaller outfits looking to minimize development efforts by sticking to the two big ecosystems.”
Operating System Highlights
Android reached a new record for market share during 2Q14, nearly doubling its share from just three years ago. Samsung once again led the charge, accounting for 29.3% of all Android-powered shipments, down from its 40.0% share of two years ago. Since then, competitors including Coolpad, Huawei, Lenovo, LG, Xiaomi, and ZTE have all grown their respective volumes are jockeying for position in the rankings behind Samsung.
iOS may have reached its lowest quarterly volume for the year, if history is any indication. For the past two years, third quarter volumes received a boost from shipments of its new devices towards the end of the quarter, resulting in slightly higher volumes compared to the second quarter. Whether or not this happens again this year remains to be seen, especially with the anticipated arrival of large-screen iPhones.
Windows Phone volumes declined from a year ago, but compared to the previous quarter, it showed slight improvement, making it the clear number 3 smartphone platform. The list of OEM partners has not changed significantly from a year ago, but that could start to change during the second half of 2014 when numerous vendors within key emerging markets come on board, including BLU, Micromax, Prestigio, Yezz, and others. These join Foxconn, Gionee, JSR, Karbonn, Lava, Lenovo, LG, Longcheer, and ZTE.
Following three consecutive quarters of sequential decline, BlackBerry volumes have rebounded slightly from the previous quarter, but remain 78.0% lower than shipment levels from a year ago. In keeping with its strategy, BlackBerry saw improvement within one of its key markets, Asia/Pacific, as well as some gains among enterprise users within North America and Western Europe.
Source: IDC Worldwide Mobile Phone Tracker, August 14, 2014
IDC Tracker products provide market size, vendor share, and forecasts for hundreds of technology markets from more than 100 countries around the globe. Using proprietary tools and research processes, IDC’s Trackers are updated on a semiannual, quarterly, and monthly basis. Tracker results are delivered to clients in user-friendly excel deliverables and on-line query tools. The IDC Tracker Charts app allows users to view data charts from the most recent IDC Tracker products on their iPhone and iPad.
For more information, visit:
http://www.idc.com