Microsoft Surface Beats iPad Pro In 2017 J.D. Power Tablet Satisfaction Survey
Microsoft ranks highest in overall satisfaction in the J.D. Power 2017 U.S. Tablet Satisfaction Study, beating out Apple’s iPads for the first time since the study’s inception. With an overall satisfaction score among tablet owners of 855 (on a 1,000-point scale), J.D. Power says Microsoft’s achievement is largely due to its top rankings in the features and styling & design factors.
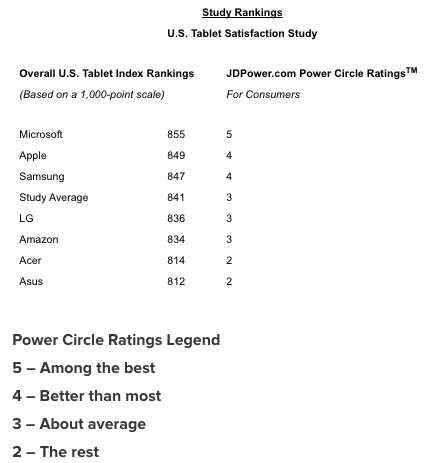 Table courtesy J.D.Power
“The Microsoft Surface platform has expanded what tablets can do, and it sets the bar for customer satisfaction,” commented Jeff Conklin, vice president of service industries at J.D. Power. “These tablet devices are just as capable as many laptops, yet they can still function as standard tablets. This versatility is central to their appeal and success.”
In features, Microsoft is the highest performer in three areas: variety of pre-loaded applications; internet connectivity; and availability of manufacturer-supported accessories. Microsoft Surface users have the highest incidences of accessory use, which underscores the device’s versatility. These accessories include a stylus (48% vs. 27% industry average); physical keyboard (51% vs. 14%); and mouse (27% vs. 6%), all of which have higher satisfaction [notably, Apple has thus far refused productivity oriented users’ appeals for mouse support in the iPad]. Microsoft also achieves the highest ratings in these features attributes: variety of input/output connectivity [another shortcoming with the iPad],and amount of internal storage available.
Additionally, Microsoft has the highest performance in three styling & design attributes: size of tablet; quality of materials used; and attractiveness of tablet design. Microsoft continues to achieve the highest rating in the remaining styling & design attribute of location of non-display buttons/controls.
J.D. Power also found that Microsoft tablet users are more likely to be early adopters of technology. More than half (51%) of Microsoft tablet customers say they “somewhat agree” or “strongly agree” that they are among the first of their friends and colleagues to try new technology products. This is relevant because early adopters tend to have higher overall satisfaction (879 among those who “somewhat agree” or “strongly agree” with this statement vs. 816 among those who do not).
Microsoft also has a higher proportion of younger customers than their competitors. Microsoft customers are notably more likely to consider productivity features as important. For example, when customers are asked the importance of their tablet to perform certain jobs well, Microsoft owners have the highest incidence of saying “very important” for jobs related to productivity. These include browsing the internet (90% vs. 75% industry average); emailing (76% vs. 61%); word processing (63% vs. 30%); and mobile payments/banking (53% vs. 40%).
Following are some of the key findings of the 2017 Study:
Satisfaction is rising: Overall customer satisfaction with tablet devices is 841, an increase of 21 index points from the 2016 U.S. Tablet Satisfaction Study—Volume 2, released six months ago.
Driving the selection process: Lower price and past experience are the most commonly cited reasons for tablet selection among customers (22% each). Reputation is next at 19%.
Size matters: The average screen diagonal among Microsoft customers is highest, at 11.8 inches. Satisfaction is 869 among customers whose screen diagonal is 10 inches or more vs. 850 among those whose screen diagonal is 8-10 inches and 824 among those whose screen diagonal is less than 8 inches.
Data plans increase satisfaction: Nearly one-third (32%) of customers have a data plan with their tablet. Overall satisfaction among customers with a data plan is 863 vs. 834 among those without such a plan.
The U.S. Tablet Satisfaction Study, now in its sixth year, measures customer satisfaction with tablets across five factors (in order of importance): performance (28%); ease of operation (22%); features (22%); styling and design (17%); and cost (11%). The 2017 study is based on experiences evaluated by 2,238 tablet owners who have owned their current device for less than one year. The study was fielded between October and December 2016.
For more information, visit:
http://www.jdpower.com
Source: J.D. Power